
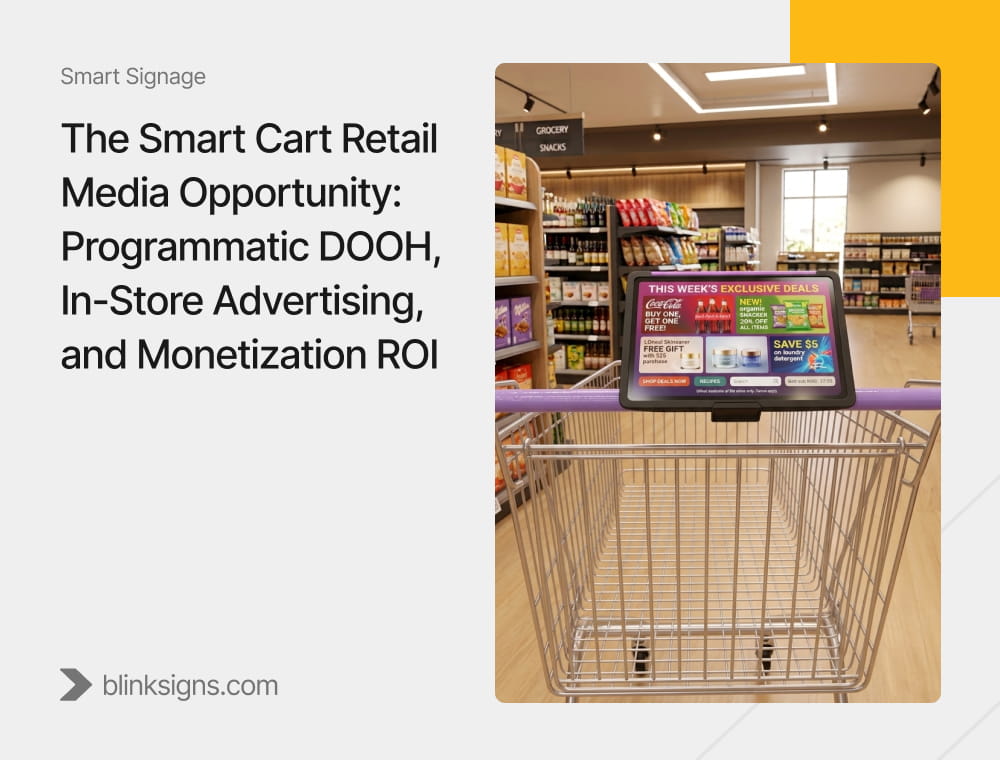
The Smart Cart Retail Media Opportunity: Programmatic DOOH, In-Store Advertising, and Monetization ROI
Smart cart retail media turns connected shopping carts into mobile digital media surfaces that reach shoppers near the physical point of purchase. In documented commercial systems, advertising can respond to factors such as aisle location, campaign targeting, and whether the promoted product is currently in stock. The commercial opportunity comes from combining this physical media surface with retailer data, transaction measurement, and retail media network infrastructure rather than from the screen alone.
The opportunity matters because physical stores still account for more than 80% of retail sales, while in-store media represented only 3.3% of non-Amazon US retail media spending in 2025. EMARKETER expects total US retail media advertising spending to reach $72.97 billion in 2026, up 20.3% year over year.
Independent research also provides evidence that media located near the point of purchase can influence purchasing decisions. A 2026 Journal of Retailing field quasi-experiment involving 1,236 grocery shoppers found average total spending of €52.95 among shoppers exposed to location-sensitive cart advertising versus €46.15 among shoppers using carts without digital advertisements, a gross observed difference of 14.7%. That result is commercially important, but it should not be treated as a universal causal sales-lift benchmark.
The strategic question is therefore no longer simply whether a shopping cart can carry a screen.
The question is whether retailers can turn smart carts into a measurable, economically sustainable, and operationally scalable in-store retail media infrastructure.
Why Is Smart Cart Retail Media Emerging Now?
Smart cart retail media is emerging because retail media investment has developed much faster online than inside physical stores, even though most retail sales still occur offline. Connected carts create another addressable in-store surface that can operate near the shelf and the shopper’s moment of decision.
EMARKETER reports that more than 80% of retail sales still take place in physical stores. Yet, the overwhelming majority of retail media investment continues to flow toward websites, apps, and other digital inventory. In-store retail media represented only 3.3% of non-Amazon retail media spending in 2025.
That imbalance creates an important commercial gap.
Retailers have spent years making e-commerce media increasingly measurable and addressable. Sponsored product ads can be tied to product availability, search behavior, audience data, and transactions. Physical stores contain similar commercial intent, but in-store media has historically been more difficult to activate and measure consistently.
IAB and IAB Europe define in-store retail media as advertising inventory that uses retail data to plan, execute, and measure within the physical store environment. Their standards cover store zones, advertising formats, measurement, and the increasing convergence between physical retail and digital media.
Smart carts extend that model by moving a digital surface through the store with the shopper.
This does not automatically make the cart a sophisticated retail media network. The value increases when the display can participate in a broader ecosystem involving retailer data, inventory, campaigns, commerce systems, and transaction measurement.
For retailers already exploring how existing displays can serve as media inventory, BlinkSigns has published a guide on converting digital signage into a structured retail media network.
Are Smart Carts Already Being Deployed at Commercial Scale?
Yes, commercial smart-cart deployment has moved beyond isolated laboratory tests. However, the market remains early, and vendor deployment numbers should be identified as vendor-reported rather than independent market-size estimates.
In June 2026, Instacart reported that Caper Carts had reached more than 100 cities in 15 US states and were available at more than a dozen retail banners, including Kroger, Schnucks, Wakefern banners, and Coles in Australia. Instacart also reported that its deployed Caper Cart count had tripled year over year.
International deployment has also continued. On July 28, 2026, Morrisons launched Caper smart trolleys at its Preston supermarket, marking Instacart’s first Caper retail partnership in the United Kingdom.
These figures establish that connected shopping carts are being used in real retail environments. Still, they should not be interpreted as an independent estimate of the entire global smart-cart market.
Current Caper documentation describes integrated cameras, sensors, scales, payment hardware, loyalty connectivity, running basket totals, automatic item recognition, aisle-aware offers, and on-cart checkout. These are capabilities of the Caper platform, not universal capabilities of all smart carts.
That distinction is central to an evidence-led analysis.
What Is Smart Cart Retail Media?
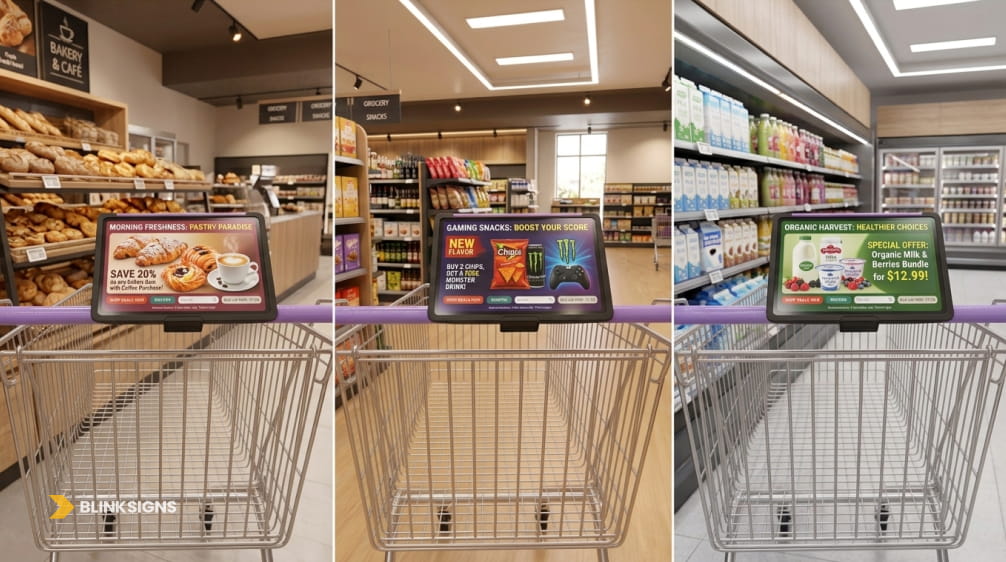
Contextual advertising across smart cart screens
Smart cart retail media is advertising delivered via connected shopping-cart displays within a retailer’s physical media environment. Depending on the platform, ad delivery may use retailer data, aisle context, inventory availability, campaign targeting, or shopper interactions to determine which commercial message appears.
The term sits at the intersection of several related but different concepts.
| Entity | Evidence-Based Meaning | Relationship to Smart Carts |
| Digital signage | Digitally controlled screen-based communication in a physical environment | A cart-mounted screen can function as digital signage |
| In-store retail media | Advertising inventory using retail data for planning, execution, or measurement inside a physical store | Smart-cart inventory can become part of a retailer’s in-store media network |
| DOOH | Digital media is used for marketing outside the home through dynamic digital screens in public or commercial spaces | A cart display can fall within the broader commercial DOOH environment |
| Programmatic DOOH | DOOH inventory transacted using programmatic buying infrastructure | Applies only when the inventory is actually available through an applicable programmatic transaction mechanism |
| Retail Media Network | A retailer-controlled advertising ecosystem built around retail inventory, audiences, data, and commerce outcomes | Smart carts can add a physical inventory surface to the RMN |
IAB defines DOOH as digital media used for marketing outside the home and explicitly includes dynamic digital screens serving one-to-one or one-to-many audiences in public and commercial environments.
The critical distinction is:
Smart-cart advertising can be digital signage, DOOH, and in-store retail media without automatically being programmatic DOOH.
That distinction prevents a common category error.
Do Smart Cart Ads Actually Increase Sales?
A recent peer-reviewed field study suggests that location-sensitive digital advertising on shopping-cart screens can increase purchases in a grocery store setting. However, the study’s observed 14.7% difference in total spending should not be presented as a universal smart-cart sales-lift benchmark.openaccess.city.ac+1
A 2026 Journal of Retailing study, “Smart Mobile Advertising at the Point of Purchase: Digital Shopping Cart Displays Increase Sales,” examined location-based advertisements displayed on shopping-cart screens during real grocery-shopping trips. The researchers conducted a field quasi-experiment involving 1,236 shoppers over eight days in a mid-sized European grocery store. Shoppers were assigned to standard carts without displays, carts with centrally positioned digital ads, or carts with peripheral ads intended to align more closely with the advertised product’s store location.openaccess.city.ac+1
Bluetooth beacons divided the store into zones. When a shopper using a digital cart entered a relevant zone, the cart screen displayed an advertisement for products available in that area of the store.
What the study found
The researchers found that location-sensitive cart advertisements increased purchasing of advertised products, including purchase quantity and spending. The ads also increased the quantity, variety, and spending of non-advertised products within the advertised category, suggesting that the effect extended beyond the promoted SKU to related category purchases.
Both digital-ad formats outperformed carts without digital advertising. However, the peripheral placement format did not reliably outperform the central placement format. In other words, the evidence supports the value of location-sensitive cart advertising in the tested setting, but it does not establish that a peripheral screen position is inherently more effective than a central one.
The reported average total spending was:
| Study condition | Average total spending |
| No digital cart advertising | €46.15 |
| Digital cart advertising | €52.95 |
| Gross observed difference | €6.80 |
| Gross percentage difference | 14.7% |
The €6.80 difference between €46.15 and €52.95 equals roughly 14.7% of the no-ad-cart average. This is best described as an observed difference in average basket spending between the study conditions, rather than a universally applicable sales-lift estimate.
The study provides credible real-world evidence that smart-cart advertising can affect purchase behavior, but several design and context limitations matter:
- The researchers describe the design as a quasi-experiment rather than a fully randomized controlled trial. Shoppers could not be completely randomized across cart conditions, so the raw basket-spending difference should be interpreted more cautiously than a clean randomized causal estimate.
- The experiment took place in a mid-sized European grocery store and lasted only eight days. Store format, local shoppers, product assortment, pricing, trip purpose, seasonality, and novelty effects could all influence whether the result replicates elsewhere.
- Every displayed ad included a promotional price discount. The evidence, therefore, applies to location-sensitive advertising paired with promotions, not necessarily to full-price advertising or brand-awareness campaigns.
- The advertised products were food products. The study’s exploratory results indicated significant effects in food categories but not non-food categories; importantly, non-food products were not themselves advertised in the experiment. That means the research cannot establish whether smart-cart ads produce equivalent effects for electronics, apparel, household durables, pharmacy products, or other non-food retail categories.
- The tested system used Bluetooth-triggered, zone-based advertising on a specific shopping-cart display setup. Results may vary across stores, cart hardware, screen size, creative quality, ad frequency, targeting rules, shopper privacy practices, and retail-media execution.
Location-sensitive smart-cart advertising can influence real purchasing behavior under documented grocery-store conditions. The study supports the idea that contextually relevant, in-aisle digital ads can increase purchases of promoted products and may also increase related category spending.
What Does Broader In-Store Digital Signage Research Show?
A separate large-scale field study provides strong evidence that fixed in-store digital signage can increase the probability that shoppers purchase advertised products. The evidence supports treating smart carts and fixed displays as complementary media formats rather than assuming one replaces the other.
A Journal of Marketing study analyzed 237 field experiments conducted between 2018 and 2022 and a dataset involving approximately 30 million shoppers. The researchers used shopping-cart RFID data to identify advertising exposure and link it to individual shopping receipts.
Exposure to the digital signage increased the probability of purchasing the featured product by 8.1% on average. The effect varied across conditions and was stronger for factors including hedonic products, novel products, lower-priced products, popular brands, later times of day, crowded stores, emotional messages, and closer proximity between the screen and the featured product.
The metric is purchase probability, not an 8.1% increase in shopper spending.
The researchers also found that digital signage did not increase spending on the featured product among shoppers who had already purchased it. Instead, a larger share of exposed shoppers purchased the featured product.
That distinction should remain explicit.
What Do the Two Studies Establish Together?
The smart-cart and fixed-signage studies examined different media systems and should not be treated as equivalent experiments.
Together, however, they support a narrower conclusion:
Digital media delivered near the physical point of purchase can measurably influence purchasing behavior, and the media’s context and proximity matter.
BlinkSigns supports nationwide retail signage programs that include design, fabrication, installation, maintenance, and digital displays across multi-location environments.
How Does Smart Cart Advertising Work in a Documented Commercial System?
Current smart-cart advertising can combine physical aisle context, product availability, campaign targeting, and automated ad selection. Instacart’s Caper Cart advertising system provides a documented commercial example, but its architecture should not be generalized to every smart-cart platform.
Instacart allows eligible shoppable display campaigns to extend onto Caper Cart screens.
For an advertisement to serve on a Caper Cart, Instacart currently documents three core conditions: an advertised product must be in stock in the aisle the cart enters, campaign targeting must be relevant to that aisle context, and the eligible advertisement must compete in a first-price CPM auction.
The evidence-supported sequence is therefore:
Cart enters relevant aisle → eligible in-stock product exists → targeting matches → first-price CPM auction occurs → winning ad appears on the cart display.
Instacart provides the example of a cart entering a breakfast aisle and campaigns associated with terms such as cereal, oatmeal, syrup, or pancakes becoming eligible to serve.
How Does Instacart Define a Caper Cart Impression?
Instacart currently counts a Caper Cart impression after the advertisement has appeared on the screen for one second. A click is recorded when the shopper directly interacts with a clickable part of the creative, such as clipping a coupon.
Caper-specific campaign reporting is not currently available as a standalone report in Ads Manager. Instacart says reporting is aggregated across eligible campaign surfaces, including Caper.
This is important because ad delivery, reporting, attribution, and causal measurement are separate capabilities.
Are Smart Carts Replacing Fixed In-Store Digital Signage?
No evidence currently supports treating smart carts as a replacement for fixed digital signage. The formats behave differently and can serve different roles across the shopper journey.
The Journal of Marketing Research studied fixed screens positioned above store aisles. Shopper proximity to those screens determined exposure.
The Journal of Retailing smart-cart study used screens mounted directly on shopping carts, with advertisements changing based on the store zone the cart entered.
The formats, therefore, have structurally different relationships to the shopper.
| Capability | Fixed Digital Signage | Smart Cart Display |
| Screen position | Fixed | Moves with the shopper |
| Typical exposure model | Shopper enters screen zone | Display travels through the shopping journey |
| Audience relationship | Often one-to-many | Primarily cart/session level |
| Context | Screen location | Cart location and platform-specific signals |
| Interaction | Format dependent | Potentially interactive |
| Basket awareness | Usually indirect | Possible on integrated smart-cart platforms |
| Retail media role | Reach and category influence | Contextual journey-level media |
IAB’s DOOH and in-store retail media work similarly describe physical retail as an increasingly connected environment that combines screens, data, shopper experience, measurement, and various media formats.
A more useful strategic question is therefore:
Which physical media surface should perform which role across the shopper journey?
For retailers already operating fixed displays, BlinkSigns has a related guide on how to structure those assets as monetizable retail media inventory.
Read BlinkSigns’ Retail Media Networks for Digital Signage Guide
Where Does Programmatic DOOH Fit Into Smart Cart Retail Media?
Programmatic DOOH should be treated as a transaction layer that may be added to qualifying smart-cart inventory. It should not be used as a synonym for smart-cart advertising, contextual ad serving, or an internal automated auction.
IAB defines DOOH as digital media used for marketing outside the home, delivered via dynamic digital screens that serve audiences in public and commercial spaces. Its framework recognizes data-driven dynamic content and both one-to-one and one-to-many environments.
Programmatic describes how inventory is bought and sold, not whether the screen is digital or context-aware.
Instacart documents that eligible Caper Cart campaigns compete through a first-price CPM auction within the Instacart Ads system.
That supports the description of auction-based retail media advertising.
It does not, based on the evidence reviewed here, establish that all Caper Cart inventory is universally accessible through external DOOH SSPs and independent DSPs as open-market pDOOH inventory.
A useful maturity model is:
Digital cart screen → contextual ad delivery → retailer-owned media inventory → automated retail-media auction → externally interoperable programmatic DOOH, where supported
This is a conceptual maturity model rather than an IAB-standard taxonomy.
What Is Closed-Loop Attribution in Smart Cart Retail Media?
Closed-loop attribution connects advertising exposure to a subsequent commerce outcome using data from the same retail environment. In smart-cart media, the goal is to determine whether an exposed shopping session subsequently resulted in a relevant transaction.
The concept is already feasible in physical retail.
The large Journal of Marketing digital-signage study used shopping-cart RFID data to identify advertising exposure and matched those exposure records to individual receipts. That allowed researchers to analyze whether exposure affected the probability of purchase.
A high-level evidence-safe measurement chain is:
Media exposure → shopping session or exposure record → transaction record → outcome analysis
The specific technical implementation varies.
It may involve cart identifiers, RFID, authenticated loyalty accounts, POS records, platform-generated session IDs, or other privacy-compliant approaches. No single identity architecture should be presented as a universal smart-cart standard.
IAB’s in-store measurement standards and advanced measurement guidance emphasize consistent definitions, data quality, outcome measurement, collaboration, and closed-loop measurement as retail media matures.
What Is the Difference Between Attribution and Incrementality?
Attribution asks whether a purchase occurred after exposure to advertising. Incrementality asks whether the advertising caused additional business that would not otherwise have occurred. Smart-cart retail media needs both concepts because physical context can reveal strong pre-existing shopper intent.
Consider a shopper entering a detergent aisle.
The cart serves a detergent advertisement.
The shopper buys detergent.
An attribution system can connect exposure to purchase.
It cannot automatically prove that the shopper purchased detergent because of the advertisement.
The shopper may have entered the aisle specifically because detergent was already on the shopping list.
IAB and IAB Europe state that credible incrementality measurement requires a meaningful counterfactual, control of bias, and separation of signal from noise. Their 2025 guidance discusses experimental designs, model-based counterfactuals, econometric approaches, and hybrid methods.
The measurement hierarchy is therefore:
| Measurement Layer | Core Question | What It Establishes |
| Exposure | Was the ad delivered under the network’s impression rules? | Media delivery |
| Attribution | Did an exposed session later produce the target commerce outcome? | Association |
| Incrementality | How much additional business happened because of the advertising? | Causal contribution, subject to methodology |
This distinction should sit at the center of any serious RMN measurement strategy.
What Privacy and Data-Governance Controls Does Smart Cart Retail Media Require?
Smart-cart retail media can involve location signals, cart-session data, loyalty information, advertising exposure, and transaction records. Retailers, therefore, need clear data purposes, minimization, access controls, retention policies, vendor governance, security, and legally appropriate consent or opt-out mechanisms where applicable.
Retail media becomes more measurable as more data sources are connected, but more data does not automatically mean better governance.
IAB’s privacy research highlights issues including data minimization, secondary-use limitations, vendor due diligence, data de-identification, sensitive information, and data-clean-room governance. It also warns that data clean rooms should not be assumed to fully de-identify all personal information.
IAB’s retail media measurement guidelines additionally recommend secure storage, controlled access, retention policies, data validation, and compliance with applicable privacy requirements.
A smart-cart retail media program should therefore define the roles of the retailer, technology provider, media platform, advertiser, measurement provider, and any data-collaboration partner before campaigns scale.
A data clean room can reduce raw data movement and enable controlled collaboration, but it should be treated as a governance technology rather than an automatic privacy exemption.
Privacy requirements vary by jurisdiction and implementation, so legal obligations should be reviewed by qualified privacy and legal teams rather than inferred from a generic retail-media architecture.
The Smart Cart Retail Media ROI Model
How Should Retailers Calculate Smart Cart ROI?
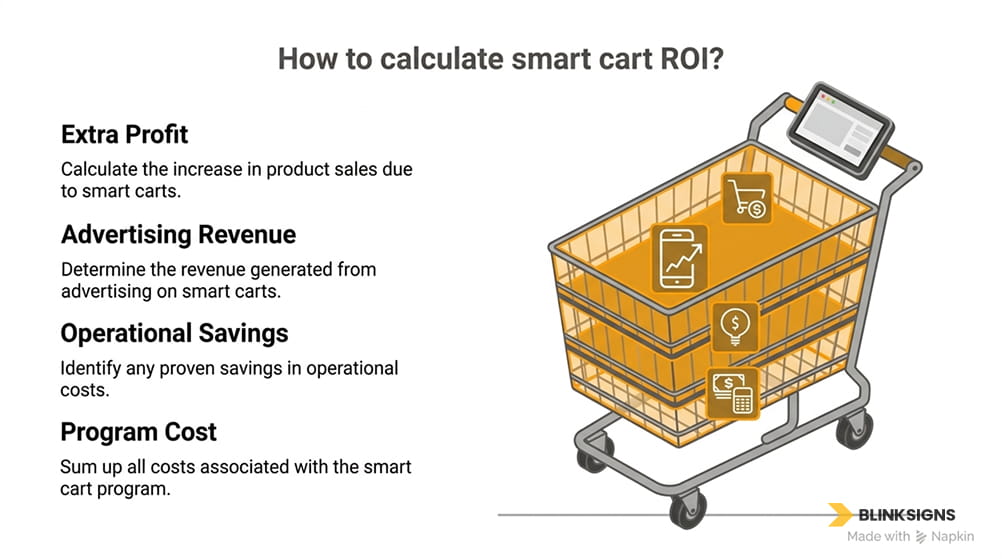
Key components for calculating cart ROI.
Smart cart ROI is simply the value a retailer gains from the program minus the total cost of running it.
Retailers should look at four things:
- Extra profit from product sales
- Revenue earned from advertising
- Operational savings, if they can be proven
- The total cost of the smart cart program
The basic idea is:
Smart Cart ROI = Total Financial Benefit – Total Program Cost
The important point is that retailers should use their own real numbers.
There is currently no reliable industry-wide benchmark for:
- smart cart hardware cost;
- installation cost;
- advertising CPM;
- retailer media revenue share;
- maintenance cost;
- payback period;
- expected sales increase.
The 2026 smart-cart study found a 14.7% gross difference in basket spending in its specific experiment, but retailers should not assume they will automatically achieve a 14.7% increase in sales.
That result demonstrates that smart-cart advertising can influence purchasing. It does not provide a guaranteed ROI benchmark for every retailer.
What Money Can a Retailer Make From Smart Carts?
Retailers can potentially create value from three main areas.
1. Extra Profit From Product Sales
Smart-cart advertising may encourage shoppers to purchase promoted products or additional products within the same category.
However, retailers should measure profit, not just sales revenue.
For example:
If smart-cart advertising generates an additional $10,000 in sales, but the retailer earns only a 30% margin on those products, the actual merchandise contribution is approximately:
$10,000 × 30% = $3,000 in gross profit
This is why basket growth alone should not be treated as ROI.
The 2026 smart-cart study also used discounted advertised products, which makes this distinction especially important. Higher unit sales do not necessarily produce the same percentage increase in profit.
2. Advertising Revenue
Retailers may also earn revenue by selling advertising on smart-cart screens.
For example, brands could pay to promote products when shoppers enter relevant areas of the store.
The retailer’s actual media income depends on factors such as:
- number of available ad impressions;
- advertiser demand;
- campaign pricing;
- percentage of inventory sold;
- platform fees;
- technology costs;
- media sales costs;
- revenue-sharing agreements.
The calculation can therefore be kept simple:
Net Media Revenue = Advertising Revenue – Media-Related Costs
Retailers should use actual campaign pricing rather than assume that all smart-cart ads will sell at the same CPM.
3. Operational Value
Some purpose-built smart carts provide features beyond advertising.
For example, Instacart documents Caper Cart capabilities, including:
- on-cart checkout;
- loyalty integration;
- running basket totals;
- automatic item recognition;
- aisle-aware offers.
These features could potentially improve store operations, but retailers should not assume they automatically reduce labor or operating costs.
Operational benefits should only be included in ROI after they are measured.
Useful questions include:
- Do shoppers use on-cart checkout?
- Does it reduce pressure on traditional checkout lanes?
- Does staff intervention increase or decrease?
- How often do carts require maintenance?
- How much downtime occurs?
- Do support requests increase?
- Does shrink change?
- Does loyalty participation increase?
If the retailer cannot measure the benefit, it should not be counted as financial value.
What Does a Smart Cart Program Cost?
Retailers should separate upfront costs from ongoing costs.
Upfront Costs
These can include:
- smart cart hardware;
- software integration;
- POS or loyalty integration;
- store readiness;
- installation;
- employee training;
- initial configuration.
These costs normally occur before or during deployment.
Ongoing Costs
These can include:
- software subscriptions;
- connectivity;
- maintenance;
- hardware replacement;
- field service;
- advertising operations;
- measurement and analytics;
- Ongoing technical support.
This gives retailers a much easier financial model:
| Money Coming In | Money Going Out |
| Extra merchandise profit | Smart cart hardware |
| Advertising revenue | Installation and integration |
| Verified operational savings | Software/platform fees |
| Other proven financial benefits | Maintenance |
| Support and field service | |
| Measurement and analytics |
The business case works when the long-term value on the left meaningfully exceeds the total cost on the right.
How Should Advertisers Measure Smart Cart Advertising ROI?
Do Attributed Sales Equal Advertising Success?
Not necessarily. A shopper may purchase a product after seeing an advertisement, even if they were already planning to buy it.
For example:
A shopper enters the cereal aisle.
The smart cart displays a cereal advertisement.
The shopper buys cereal.
The retailer can say to the shopper:
Saw the ad → Bought the product
That is attribution.
But the shopper may have entered the cereal aisle because cereal was already on the shopping list.
The more important question is:
Would the shopper still have bought the cereal if the advertisement had never appeared?
That is incrementality.
IAB’s incrementality guidance recommends using control groups, experiments, matched-market analysis, or other credible comparison methods when businesses want to understand whether advertising actually caused additional sales.
A Simpler Way to Measure Advertiser Return
Advertisers can look at two different numbers.
Standard ROAS
Standard Return on Ad Spend asks:
How much attributed revenue did we generate for every dollar spent on advertising?
Example:
- Media spend: $10,000
- Sales attributed to exposed shoppers: $40,000
Standard ROAS:
$40,000 ÷ $10,000 = 4x ROAS
That sounds strong.
But it does not tell us how much of that $40,000 would have happened anyway.
Incremental Profit Return
A stronger measurement asks:
How much additional profit did the campaign actually create?
For example:
- Exposed shoppers generated $40,000 in sales.
- Comparable shoppers without the advertising would have generated $32,000.
- The campaign, therefore, produced $8,000 in incremental sales.
If the contribution margin on that additional business was 30%, the campaign created:
$8,000 × 30% = $2,400 in incremental contribution profit
That gives the advertiser a much clearer picture of the campaign’s real economic impact.
For this article, we can call this approach Incremental Profit ROAS, or iPROAS.
It is a planning framework used in this analysis, not an official IAB-standardized metric.
The simple idea is:
iPROAS = Incremental Profit Generated ÷ Media Spend
For a complete business case, advertisers can also compare incremental profit against the total campaign cost, including media, creative production, measurement, agency fees, and platform expenses.
How Should Retail Media Networks Measure Smart Cart Media Revenue?
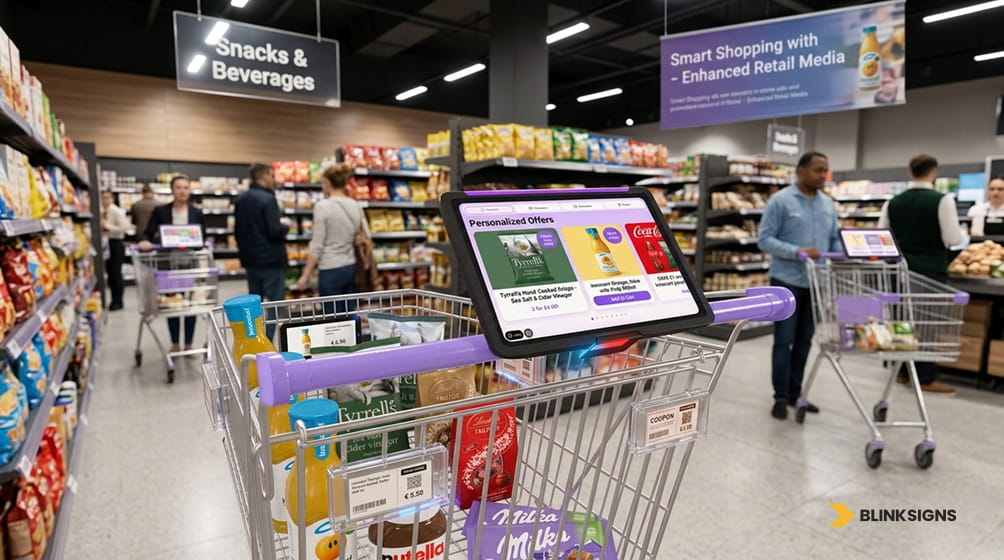
Measuring retail media smart cart revenue.
How Does an RMN Make Money From Smart Cart Ads?
A retail media network earns money by selling advertising opportunities on smart-cart screens. Its real financial value depends on how much inventory it can sell, what advertisers actually pay, and how much it costs to operate the media network.
The basic model is:
Media Revenue = Ads Sold × Actual Advertising Price
Several factors influence the revenue.
Available Advertising Inventory
The RMN needs enough active smart-cart usage to create meaningful media inventory.
Inventory can depend on:
- number of active carts;
- number of shopping trips;
- campaign eligibility;
- how frequently ads can reasonably be shown;
- store traffic;
- aisle context;
- available campaigns.
Fill Rate
Not every available advertising opportunity will necessarily be sold.
If the network could serve 1 million advertising impressions, but advertisers buy only 600,000, the effective fill rate is:
60%
Higher advertiser demand generally improves utilization of available inventory.
Actual CPM
CPM means the amount an advertiser pays for 1,000 impressions.
There is currently no reliable universal CPM benchmark for smart-cart advertising.
Actual pricing can vary depending on:
- retailer;
- brand;
- category;
- geography;
- shopper context;
- advertiser demand;
- campaign objective;
- measurement quality;
- inventory availability.
Instacart confirms that eligible Caper Cart advertisements compete through a first-price CPM auction inside the Instacart Ads platform. Still, it does not publish a universal smart-cart CPM that every retailer should use.
Retailers should therefore use actual campaign pricing when calculating media economics.
Gross Media Revenue Is Not the Same as Profit
The RMN must also subtract the cost of operating the advertising business.
Those costs may include:
- ad technology;
- campaign management;
- media sales;
- measurement;
- reporting;
- agency or platform fees;
- technical operations;
- data and analytics.
The calculation becomes:
Net Media Contribution = Advertising Revenue – Cost of Running the Media Program
This is the figure that matters most when deciding whether smart-cart media is economically attractive.
The Simplest Way to Think About Smart Cart Economics
Three separate groups are making three different financial decisions.
| Stakeholder | Main Question |
| Retailer | Does the program as a whole make more money than it costs? |
| Advertiser | Did the advertising create additional profitable sales? |
| Retail Media Network | Does selling smart-cart advertising generate profitable media revenue? |
Retailer
Extra merchandise profit + advertising income + proven operational savings – total program costs
Advertiser
Incremental profit caused by the campaign – advertising investment
Retail Media Network
Advertising revenue – cost of selling and operating the media inventory
Keeping these three perspectives separate makes the business case much easier to understand.
The retailer should not confuse higher basket revenue with profit.
The advertiser should not confuse attributed sales with incremental sales.
The retail media network should not confuse theoretical advertising inventory with actual revenue.
That is the simplest way to evaluate whether smart-cart retail media creates real economic value.
What Smart Cart Deployment Models Should Retailers Evaluate?
Three deployment archetypes are useful for planning: retrofit digital capability added to existing carts, purpose-built smart carts, and connected environments combining carts with fixed media. These are analytical archetypes, not formal industry standards.
1. Retrofit Cart Display
A retrofit approach adds digital capabilities to an existing cart fleet rather than replacing the entire cart architecture.
Possible functions include shopper information, digital promotions, advertising, navigation, or other connected services.
The specific requirements for mounting, power, charging, network access, durability, security, positioning, software, and maintenance depend on the technology selected.
No credible universal retrofit cost-per-cart or deployment-time benchmark was identified in the evidence reviewed for this article.
Those figures should come from actual vendor proposals and store-level pilot work.
2. Purpose-Built Smart Cart
A purpose-built smart cart integrates the computing, sensors, display, and commerce functions directly into the cart rather than adding a standalone screen to an existing cart.
Caper is one current commercial example.
Instacart documents the integration of cameras, scales, sensors, payment hardware, item recognition, location capabilities, loyalty integration, offers, and on-cart checkout.
Importantly, Instacart currently says that Caper requires no store modifications because its cameras, sensors, scales, and payment hardware are built into the cart, and the retailer’s existing POS, payment processor, and loyalty systems can continue to operate.
That evidence demonstrates why purpose-built smart carts should not automatically be described as requiring major electrical construction, individual charging circuits, or structural cart-corrals.
Requirements are platform-specific.
3. Connected Cart + Fixed In-Store Media
Retailers can also evaluate connected environments where mobile cart screens operate alongside fixed digital displays, endcaps, wayfinding, shelf-edge media, or other in-store touchpoints. Evidence supports the broader convergence of these formats, but synchronized cross-screen orchestration should only be claimed when a particular technology stack supports it.
IAB’s DOOH and in-store retail media playbook describes an increasingly connected physical commerce environment where screens, data, shopper experience, and measurement operate together.
A useful planning framework is:
| Shopper Journey Role | Potential Surface |
| Store entry awareness | Entrance digital display |
| Broad category influence | Endcap or aisle display |
| Contextual shopping assistance | Smart-cart display |
| Product-level information | Shelf-edge digital surface |
| Checkout communication | Checkout display |
| Post-purchase engagement | Loyalty, receipt, or commerce platform |
This table is a planning model, not a claim that every retailer currently operates such an integrated architecture.
What Physical Infrastructure Does a Smart Cart Deployment Require?
There is no universal smart-cart infrastructure specification. Store requirements depend on the selected cart platform, charging architecture, network requirements, positioning technology, system integrations, store layout, and any fixed media installed alongside the carts.
This is where site readiness becomes more important than generic engineering assumptions.
Charging and Power
Retailers should establish the OEM’s documented charging method, charging location, simultaneous charging capacity, electrical requirements, operating cycle, failure behavior, and store-staging implications.
Caper demonstrates why these questions must be vendor-specific. Instacart’s current product documentation says no store modifications are required.
Network and Positioning
Connectivity requirements can differ substantially. A retailer should verify Wi-Fi or other network requirements, local versus cloud processing, positioning method, offline behavior, update mechanisms, cybersecurity responsibilities, and network segmentation against the selected platform.
The article, therefore, does not assume that every implementation requires BLE, UWB, new access points, or a dedicated edge server.
POS, Payment, Loyalty, and Inventory Integration
Potential integration points can include POS, payment processors, loyalty platforms, product catalogs, inventory, pricing, promotions, retail media systems, and measurement infrastructure.
Instacart states that Caper can operate with a retailer’s existing POS, payment processor, and loyalty program. That is a Caper-specific capability and should not be generalized to other vendors.
Physical Site Readiness
Depending on the project scope, retailers may also need to evaluate staging space, mounting locations for adjacent fixed displays, electrical access for signage, network conditions, store layout variations, installation windows, receiving, commissioning, quality assurance, and service access.
BlinkSigns’ documented site-survey process includes infrastructure evaluation, site measurements, structural conditions, installation feasibility, local regulations, and installation planning.
What Should Retailers Test Before Scaling Smart Carts?
A smart-cart pilot should test commercial performance, incrementality, shopper adoption, technical reliability, physical operations, measurement quality, and deployment repeatability. A pilot that only measures clicks or basket size is not sufficient for an enterprise rollout decision.
IAB’s 2025 in-store measurement maturity framework notes that in-store media adoption remains constrained by operational complexity, inconsistent standards, and limited comparability across networks.
The pilot scorecard can therefore be organized as follows:
| Test Area | Evidence to Capture |
| Commercial performance | Sales, contribution margin, delivered media, realized revenue |
| Incrementality | Treatment/control outcomes and credible counterfactual |
| Shopper adoption | Cart selection, repeat use, feature usage, checkout behavior |
| Reliability | Uptime, errors, failures, transaction synchronization |
| Physical operations | Charging, staging, maintenance, damage, support |
| Measurement | Match rates, data completeness, and treatment contamination |
| Deployment | Installation consistency, store exceptions, QA |
| Privacy and governance | Data flows, access, retention, vendor controls |
The goal is not to prove that the technology works in principle.
The goal is to determine whether it creates measurable economic value under real operating conditions.
A Recommended 90-Day Smart Cart Pilot Framework
A 90-day pilot is a practical planning framework for separating technical stabilization, commercial testing, and scale-readiness analysis. It is not an industry standard.
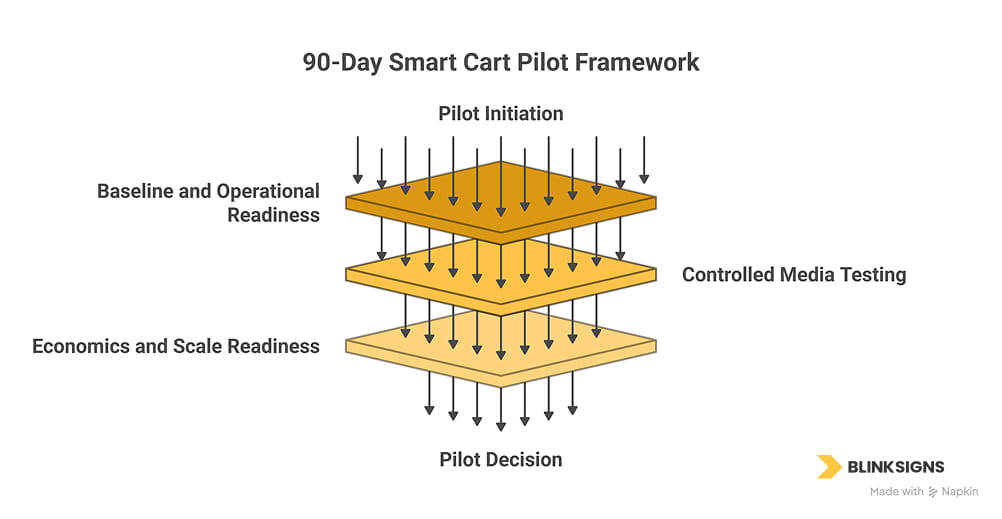
Phased framework for testing smart carts.
Days 1 to 30: Baseline and Operational Readiness
The first phase should establish baseline category performance, complete site readiness, commission hardware and integrations, validate measurement, configure treatment/control methodology, train relevant store teams, and document early reliability issues.
The decision question is:
Can the system operate reliably enough to support a valid commercial test?
Days 31 to 60: Controlled Media Testing
The second phase should test selected campaigns under stable operating conditions while tracking media delivery, purchasing outcomes, treatment/control differences, shopper adoption, operational events, and measurement quality.
IAB recommends experimental or other counterfactual methodologies when appropriate because raw attribution alone does not establish incrementality.
The decision question is:
Is the media creating measurable incremental value rather than merely capturing existing purchase intent?
Days 61 to 90: Economics and Scale Readiness
The third phase should calculate merchandise contribution, incremental profit, net media revenue, total operating cost, technical incidents, maintenance burden, measurement cost, and rollout repeatability.
The final decision should be:
Scale, redesign, extend the test, or stop.
A technically functional pilot should not automatically become a national deployment.
How Should a Retailer Decide Whether to Scale?
A retailer should scale only when the pilot establishes acceptable economics, credible measurement, shopper adoption, technical reliability, store-level operability, and repeatable deployment.
A six-gate scale framework can be used:
| Scale Gate | Decision Question |
| Economics | Does the program create positive value after realistic costs? |
| Advertiser value | Are media outcomes meaningful and incrementally defensible? |
| Shopper adoption | Do enough shoppers use the carts and core features? |
| Technical reliability | Can the system support daily retail operations? |
| Physical operations | Can stores stage, charge, maintain, and support the fleet? |
| Rollout repeatability | Can deployment be standardized across store types? |
This is a proposed deployment framework, not an industry standard.
Why Is a 500-Store Rollout Different From a Five-Store Pilot?
Scaling turns a technology experiment into a field operations problem. Store variation, installation coordination, site readiness, hardware logistics, local conditions, QA, maintenance, and exception management become increasingly important as the number of locations grows.
A multi-location program should therefore standardize site surveys, store typologies, installation templates, exception handling, QA requirements, project visibility, service responsibilities, and lifecycle support.
BlinkSigns’ retail program specifically documents centrally managed nationwide rollouts covering design, fabrication, installation, maintenance, and project management across multiple retail locations.
The company also states that it has more than 2,500 installers on board and a network of production facilities across the United States.
These are documented BlinkSigns capabilities, but they relate primarily to signage and physical deployment work. They should not be interpreted as evidence that BlinkSigns currently installs or services a particular smart-cart OEM’s proprietary hardware unless that scope is separately established.
Where Does BlinkSigns Fit in a Smart Cart Retail Media Program?
BlinkSigns is most defensibly positioned in the physical infrastructure, multi-location deployment, fixed-signage, rollout-management, and maintenance layers rather than as the smart-cart OEM, ad server, DSP, SSP, or attribution platform.
A smart-cart retail media ecosystem can be modeled across five layers:
| Layer | Primary Responsibility | BlinkSigns Alignment |
| Retail media strategy | Inventory, advertisers, media economics | Strategic context, not core documented service |
| Cart and ad-tech platform | Smart-cart hardware, software, ad serving, and POS integrations | Technology-provider scope |
| Physical store infrastructure | Signage, displays, site readiness, mounting, and related electrical work | Strong alignment within the documented signage scope |
| Multi-location deployment | Site surveys, installation coordination, QA, rollout visibility | Strong alignment |
| Lifecycle field operations | Signage maintenance, repair, and future rollout changes | Strong alignment within the documented service scope |
BlinkSigns publicly documents site surveys, infrastructure evaluation, fabrication, signage, electrical wiring, installation, electrical connections for illuminated signage, quality assurance, repair, and maintenance.
The correct positioning is therefore not:
BlinkSigns supplies the smart-cart technology stack.
It is:
BlinkSigns can support the physical-store and multi-location execution layer where the project scope falls within its documented signage, digital-display, installation, electrical, and program-management capabilities.
How Can Site Surveys Reduce Rollout Risk?
Site surveys help identify physical differences before they become rollout exceptions. This is particularly important when a connected-store program spans locations with different layouts, mounting conditions, power access, regulations, and existing infrastructure.
BlinkSigns’ site-survey services include measurements, regulatory review, infrastructure assessment, installation feasibility assessment, structural conditions assessment, environmental considerations, and detailed recommendations.
How Can Installation and Quality Assurance Be Standardized?
Multi-location physical media programs require repeatable installation and QA standards to prevent store-level variations from undermining safety, brand consistency, or long-term serviceability.
BlinkSigns documents professional installation, structural assessments, safety compliance, alignment checks, illumination testing, quality assurance, and post-installation support for signage projects.
What Role Can SignTrax Play in Multi-Location Visibility?
The digital technology platform can report what connected media is doing. The rollout management system needs to report on what is happening physically across locations.
BlinkSigns describes SignTrax as a project-tracking system that provides live updates, progress tracking, and communication around signage projects. BlinkSigns also documents project management, prototyping, nationwide installation, and maintenance as part of its broader program capabilities.
Build, Buy, or Partner: Who Should Own Each Layer?
A retailer should treat smart-cart retail media as a multi-party operating model rather than assume one vendor will own every technology, media, measurement, and physical deployment function.
A practical responsibility model is:
| Capability | Likely Primary Owner |
| Retail media strategy | Retailer / RMN |
| Advertiser relationships | Retailer / RMN |
| Smart-cart hardware | OEM / smart-cart platform |
| Cart software | Smart-cart platform |
| Media campaign management | RMN / ad-tech provider |
| Programmatic integrations | RMN and applicable SSP/DSP partners |
| POS and loyalty integration | Retailer + technology provider |
| Incrementality measurement | RMN + measurement/analytics partners |
| Data governance | Retailer + legal/privacy + technology partners |
| Store readiness | Retailer + OEM + deployment partner |
| Fixed digital signage | Retailer + signage/deployment partner |
| Physical installation | Qualified deployment partner |
| Rollout coordination | Retailer + program-management partner |
| Maintenance | OEM and/or field-service partner, depending on the scope |
The objective is not to assign everything to one supplier.
It is to eliminate ownership gaps between suppliers.
What Should Be Included in a Smart Cart RFP?
A smart-cart RFP should evaluate media, measurement, integrations, privacy, infrastructure, serviceability, deployment, and economics in addition to cart features.
| RFP Category | Questions to Resolve |
| Media | Which ad formats are supported? What determines eligibility? How is an impression defined? |
| Programmatic | Is inventory limited to the vendor platform, or is it available through external buying systems? |
| Measurement | How are exposure and transactions connected? Is incrementality testing supported? |
| Data | Which identifiers are collected? Who controls the data? What are retention and access rules? |
| Privacy | How are consent, opt-outs, minimization, security, and vendor governance handled? |
| Integrations | Which POS, payment, loyalty, inventory, pricing, and promotion systems are supported? |
| Infrastructure | What store modifications, network requirements, charging, or positioning systems are required? |
| Operations | Who services failed carts? What replacement and spare-unit model is required? |
| Deployment | Who performs site readiness, staging, commissioning, QA, and multi-store coordination? |
| Economics | What are hardware, software, implementation, media, maintenance, integration, and measurement costs? |
Without these answers, ROI modeling is likely to rely on assumptions rather than actual investment inputs.
Which KPIs Should a Smart Cart Retail Media Program Track?
A mature smart-cart program should separate media, commerce, incrementality, financial, operational, deployment, and shopper metrics rather than collapsing performance into one headline KPI.
| KPI Family | Examples |
| Media delivery | Eligible impressions, delivered impressions, realized eCPM, fill |
| Shopper adoption | Cart adoption, active trips, repeat usage, feature engagement |
| Commerce | Units, basket value, category sales, contribution margin |
| Incrementality | Incremental units, incremental revenue, incremental contribution |
| Advertiser economics | ROAS, proposed iPROAS, total campaign return |
| Retailer economics | Net media contribution, merchandise contribution, and operating cost |
| Technical reliability | Uptime, errors, failed carts, payment, or synchronization failures |
| Physical operations | Charging availability, damage, service events, and replacement needs |
| Deployment | Survey completion, installation completion, and QA pass rate |
| Measurement quality | Match rate, missing data, contamination, confidence |
| Shopper experience | Satisfaction, support requests, abandonment, interventions |
IAB’s measurement frameworks emphasize consistent definitions, transparent methodology, data quality, and comparability as prerequisites for mature in-store media measurement.
Frequently Asked Questions About Smart Cart Retail Media
Are Smart Cart Ads Retail Media?
Yes, when the inventory operates within a retailer’s physical media environment and uses retail data for planning, execution, or measurement, it fits IAB’s definition of in-store retail media.
Are Smart Cart Screens DOOH?
They can fit within the broader DOOH category. IAB defines DOOH as digital marketing media delivered through dynamic screens in public and commercial spaces, including one-to-one and one-to-many environments.
Is Smart Cart Advertising Automatically Programmatic DOOH?
No. Contextual targeting or an automated retailer auction does not, by itself, prove that inventory is available through an external PDOOH buying infrastructure.
Do Smart Cart Ads Increase Sales?
Peer-reviewed evidence shows that location-sensitive cart advertisements can increase purchasing under specific grocery-store conditions. One 2026 study reported average basket spending of €52.95 with cart advertising versus €46.15 without it. Still, the study was quasi-experimental, used discounted food advertisements, and was conducted in a single European grocery store. The 14.7% gross difference should therefore not be treated as a universal causal benchmark.
Does Fixed Digital Signage Increase Sales?
Large-scale field evidence indicates that it can increase the probability of purchasing featured products. A Journal of Marketing dataset covering 237 campaigns and approximately 30 million shoppers found an average 8.1% increase in purchase probability following exposure.
Do Smart Carts Require New Electrical Infrastructure?
Not always. Requirements depend on the platform. Instacart currently states that Caper requires no store modifications, although other platforms may have different requirements for charging, networking, positioning, or installation.
What Is Closed-Loop Attribution?
Closed-loop attribution connects media exposure to a subsequent commerce outcome, such as a transaction. It establishes an exposure-to-outcome relationship but does not automatically prove causality.
What Is Incrementality?
Incrementality measures the additional business attributable to advertising compared with what would have happened without it. Credible incrementality requires an appropriate counterfactual and methodology.
How Should Smart Cart ROI Be Calculated?
Retailers should combine incremental merchandise contribution, retained media revenue, verified operational value, recurring platform and operating costs, measurement costs, and initial investment. Gross basket sales alone are not ROI.
Should Smart Carts Replace Fixed Digital Signage?
Current evidence does not support treating the formats as direct substitutes. Their exposure models differ, and they can perform different roles across the physical shopper journey.
What Should Retailers Test Before Scaling?
Retailers should validate incrementality, economics, shopper adoption, measurement quality, technical reliability, physical operations, privacy governance, maintenance, and deployment repeatability before broad expansion.
What Does the Evidence Actually Establish in 2026?
The evidence supports smart carts as an emerging in-store advertising surface, with commercial deployments, contextual ad delivery capabilities, and peer-reviewed evidence that location-sensitive cart advertising can affect purchasing. It does not establish universal profitability, universal programmatic availability, or a guaranteed performance benchmark.
| Claim | Evidence Status |
| Most retail sales still occur in physical stores | Supported by EMARKETER |
| In-store retail media remains a small share of retail media spending | Supported by EMARKETER |
| Smart carts are deployed commercially | Supported by vendor deployment records |
| Caper can use aisle and in-stock context for ad eligibility | Documented by Instacart |
| Caper advertising uses a first-price CPM auction | Documented by Instacart |
| Location-sensitive cart advertising can influence real purchases | Supported by peer-reviewed research |
| Fixed signage can increase featured-product purchase probability | Supported by large-scale field research |
| Exposure can be linked to transactions in physical retail | Demonstrated in peer-reviewed research |
| Closed-loop attribution proves causality | Not supported |
| Every smart-cart system is a programmatic DOOH | Not supported |
| Every retailer should expect a 14.7% basket lift | Not supported |
| Smart-cart CPMs fall into one universal range | Not supported |
| One standard infrastructure design applies to every platform | Not supported |
The Strategic Question Is No Longer Whether a Cart Can Carry a Screen
The commercial challenge is to turn connected in-store media into a repeatable system that delivers measurable value and can be deployed reliably across physical locations.
Smart carts are already operating in grocery environments.
Context-aware cart advertising is commercially documented.
Peer-reviewed research shows that mobile cart ads can influence actual purchases under specific conditions.
Large-scale field evidence shows that fixed digital signage can also influence the probability of purchase.
IAB standards are increasingly defining how in-store retail media should be measured.
The remaining challenge is integration.
Retailers need to connect:
media strategy + commerce data + credible measurement + privacy governance + physical infrastructure + multi-location execution
without confusing attributed sales with causal lift, vendor-specific capabilities with industry standards, or illustrative financial assumptions with proven economics.
For advertisers, the goal should be incrementally profitable business outcomes rather than attributed sales alone.
For RMN operators, the goal should be realized net media contribution rather than theoretical inventory value.
For retailers, the goal should be the total economic contribution after accounting for technology, operations, measurement, deployment, and maintenance.
For enterprise retail chains, the final challenge is physical scale.
BlinkSigns’ documented strengths sit primarily in that execution layer: nationwide retail signage programs, site surveys, fabrication, digital displays, installation, project management, quality assurance, maintenance, and rollout visibility.
Explore BlinkSigns Nationwide Retail Signage and Deployment Capabilities
The retail media platform determines what content or advertising can run.
The retailer determines how the media should create business value.
The measurement system determines whether that value can be credibly demonstrated.
The privacy framework determines how data can be responsibly used.
And the physical deployment system determines whether a promising pilot can become a repeatable multi-location program.